
Similarity Maps for Antipsychotic Medications - Part Four
Introduction
In Part Three we derived separate similarity maps for 5HT and DA. It would be helpful if this we found a single map representation that enables us to view the affinity profile or 'signature' over DA and 5HT of each medication relative to each other.
For this exercise, we'll use the same data (receptors, medications) as for part three. However, because we need complete data, we can only include medications that have coverage of the same 5HT and DA receptors, which means we lose a couple from the maps in Part Three.
The desirable property for our new map are that: we want a representation on a two-dimensional plane, with the orthogonal axes represent something meaningful - so, for example, we want the location along the x-axis to represent similarities in affinities for DA receptors, and for the y-axis, similarities for 5HT receptors.
Recall from Part Three that we have four DA receptor affinities available for each medication; looking back at Part Two recall that for 4 receptors, we have a native 4 dimensional space (imagine one axes being DA1 affinity, another being DA2 affinity and so on) with each medication being a point in this 4D space. Similarly, for 5HT, we have a 5-dimensional native space (each axes again being a receptor).
A first step, then, is to compress this 4D space of DA affinities into a one dimensional representation (just as we did for the cities example in Part Two). As before, this results in loss of information which we will mitigate against by plotting nearest neighbours derived from the distances / similarities in the native space.
Some notes: to combine DA and 5HT in one representation, we lose a few more medications because for each medication, we have to have complete DA and 5HT pKi values. As an example, we have to lose flupenthixol, because while it's DA profile is complete, there are not enough data for 5HT receptors.
Compressing 2D Dopamine Similarity Map to a Single Dimension
Our now familiar similarity-map representation (minus flupenthixol):

Figure One : DA similarity map (from 4D to 2D). The Overall Affinity colouring represents the sum of DA1-DA4 affinities for each medication.
This looks a bit cluttered because for clarity and visual comparison, I've chosen axes scales that make all the diagrams occupy the same rectangular area (later, we'll zoom them to create the final maps).
Let's now remove the nearest-neighbour arrows, and then show compression all the way down to one dimension (i.e. compress down to positions along the x-axis). In doing this, we can see if the distances in a single dimension (along the real number line) preserve enough information.
Figure Two : Compressing DA distances into 1D
Reassuringly, notice how compressing to a single one dimensional embedding preserves the ordering (from left, low overall affinity to right, high overall affinity).
Compressing 2D Serotonin Similarity Map to a Single Dimension
Now we do the same, but compressing the five dimensional 5HT receptor distances to a single dimension, which will be along the y axis. Starting with the 2D representation:
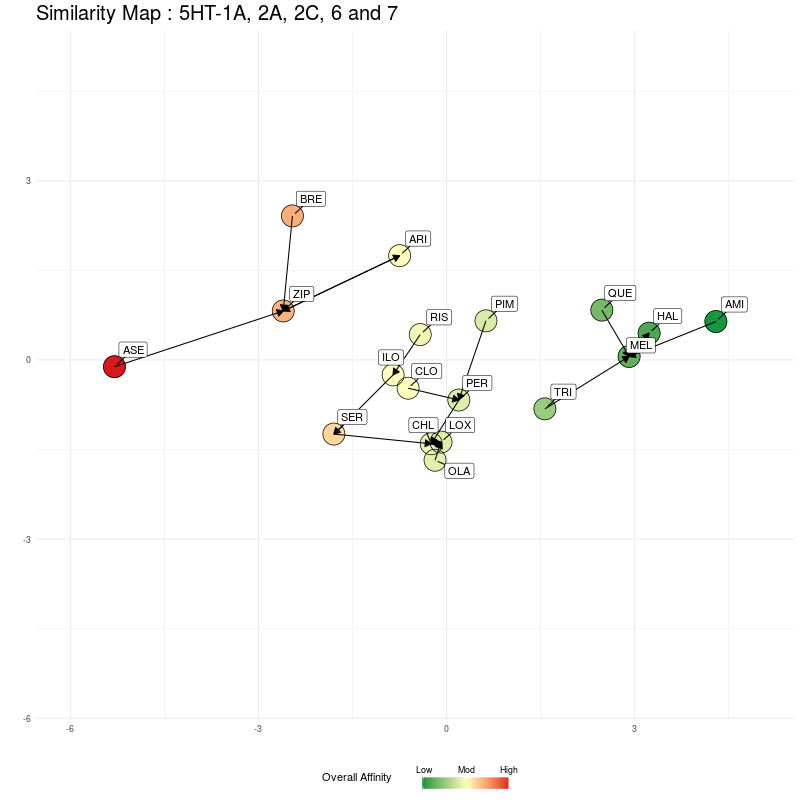
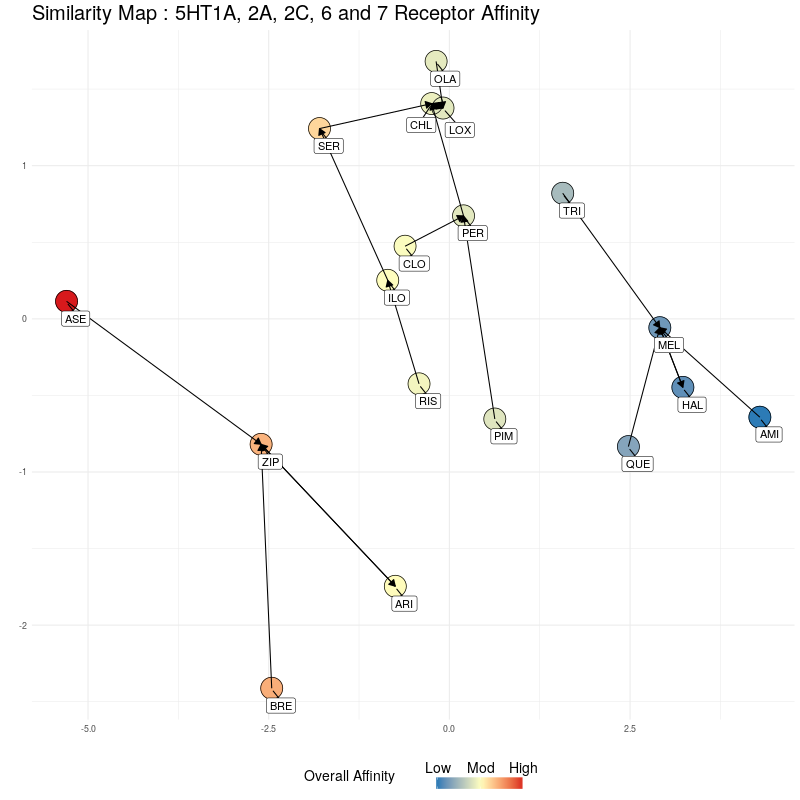
Figure Three : 5HT distances, from 5D to 2D. The Overall Affinity colouring represents the sum of 5HT1A, 2A, 2C, 6 and 7 affinities for each medication.
We compress onto a 1D line (the y-axis), again, watching for the relative distances between the different medications being preserved:
Figure Four : Compressing 5HT distances into 1D
Now we have:
- Figure Two: Positions along a horizontal axis (the x-axis) that are 1D representations (embedding) of distances between medications derived by compressing the native 4D space of DA affinities.
- Figure Four: Positions along a vertical axis (the y-axis) that are 1D representations (embedding) of distances between medications derived by compressing the native 5D space of 5HT affinities.
All that remains is to use these two 1D representations and plot them in the plane. We illustrate this by first plotting the DA embedding (along the x-axis) and then adding in the 5HT embedding (along the y-axis):
Figure Five : deriving a representation map from 1D embeddings of DA and 5HT; the overall affinity colour represents the sum of both 5HT and DA receptor affinities.
Finally, let's 'freeze' the final state of the animation above and we can scale the axes to make the map more readable. You can click to enlarge images, where the left image is the final map with arrows showing the nearest neighbour in the native 4D DA receptor space, and the arrows in the right image represent the nearest neighbour in the native 5D 5HT space.

Next Steps ...
I'm working on putting the most informative representations/maps from the past few posts into a handy PDF document that can be downloaded. The approach taken so far has been to impose a desired mapping geometry - that is, everyone likes a 2D orthogonal axis system (it's familiar).
However, the beauty of embedding methods (like MDS) is that some algorithms aim to recover a parsimonious manifold representation. You can read about manifold embedding here. Many high-dimensional spaces have an intrinsic structure that can be captured by a lower dimensional space. A great example is from Tenenbaum et al's [1] classic paper, where 64 x 64 pixel-images (photographs) of a person's head are captured in different poses. Each of these images therefore contains 4096 pixels which results in a 4096-dimensional space of information. But each image really represents an object moving in only 3-dimensions (e.g. rotating left-right, up-down and so on) and this is the intrinsic structure, or manifold, from which the 4096-dimensional space of images is derived. Tenebaum et al showed that algorithms similar to MDS can be used to extract this parsimonious 3D manifold of poses with only having access to the 4096-dimensional space of sample data. The analogy is that our brains do just this to represent rotation-invariant recognition of 3D objects in the world with - essentially - pixel-like representation transmitted from the retina.
It would be interesting to see if there are other intrinsic manifold-like structures underpinning spaces of receptor affinities for different medications. I'll have to see if it works.
References
Tenenbaum, J. B., De Silva, V., & Langford, J. C. (2000). A global geometric framework for nonlinear dimensionality reduction. science, 290(5500), 2319-2323.

